 |
| Download |
| English: |
 |
Study on the interlinkages between the chemicals and waste multilateral environmental agreements and biodiversity
At the 2002 World Summit on Sustainable Development (WSSD) governments agreed to “achieve, by 2020, that chemicals are used and produced in ways that lead to the minimization of significant adverse effects on human health and the environment […].”.
The Basel, Rotterdam, Stockholm and Minamata conventions contribute to this goal through their specific and individual legal mandates. In addition, the non-binding Strategic Approach to International Chemicals Management (SAICM), has also aimed at the 2020 goal by focusing on important chemicals and waste issues not covered by the above multilateral environmental agreements (MEAs), and is currently in the process of considering its beyond-2020 objectives, structure and targets. The United Nations Environment Assembly (UNEA), which is the governing body of the United Nations Environment Programme (UNEP), also provides leadership on chemicals issues and the interlinkages with other areas of UNEA and UNEP endeavours, such as biological diversity.
| Download |
| English: |
|
|
 |
| Download |
| English: |
|
Interlinkages between the chemicals and waste multilateral environmental agreements and biodiversity: Key insights
The 1989 Basel Convention on the Control of Transboundary Movements of Hazardous Wastes and Their
Disposal, the 1998 Rotterdam Convention on the Prior Informed Consent Procedure for certain Hazardous
Chemicals and Pesticides in International Trade, the 2001 Stockholm Convention on Persistent Organic
Pollutants, and the 2013 Minamata Convention on Mercury all aim at protecting human health and the
environment from hazardous chemicals and waste.
| Download |
| English: |
|
|
 |
| Download |
| English: |
|
Chemicals, wastes and climate change - Interlinkages and potential for coordinated action
Climate change and management of hazardous chemicals and wastes are two of the many challenges
facing policy and decision makers committed to meeting the Sustainable Development Goals, as set out in
the 2030 Agenda for Sustainable Development. A number of global agreements have been established to
address these issues. The United Nations Framework Convention on Climate Change seeks to both stabilize
greenhouse gas (GHG) concentrations in the atmosphere and adapt to the eventual inevitable impacts of
climate change. Falling within the scope of this study, hazardous chemicals related agreements include
the Rotterdam Convention on the Prior Informed Consent Procedure for certain Hazardous Chemicals
and Pesticides in International Trade, the Stockholm Convention on Persistent Organic Pollutants (POPs)
and the Minamata Convention on Mercury. Finally, the Basel Convention on the Control of Transboundary
Movements of Hazardous Wastes and Their Disposal focuses specifically on waste-related issues.
| Download |
| English: |
|
|
 |
| Download |
| English: |
|
Drowning In plastics
Drowning in Plastics - Marine Litter and Plastic Waste Vital Graphics provides a complete overview of the global challenges related to marine litter and plastic waste, using graphic illustrations accompanied by condensed descriptions of key thematic areas. It describes challenges and possible solutions across the waste hierarchy. Drowning in Plastics also provides an overview of challenges and solutions related to bioplastics, and waste management in developing countries, as well as challenges and opportunities regarding gender aspects of waste management. Moreover, the reader will find an overview of governance and policy solutions covering the Basel Convention, national policies, global responses through the United Nations Environment Assembly, other global and regional initiatives, monitoring and assessment components, and broader systemic perspectives. This publication was developed as a collaborative effort between the United Nations Environment Programme (UNEP), the Secretariat of the Basel, Rotterdam and Stockholm Conventions and GRID-Arendal.
| Download |
| English: |
|
|
 |
| Download |
| English: |
|
Waste without frontiers II
This document is the second analysis of the data transmitted under Article 13 and covers the period between 2007 and 2015. The national reports submitted by Parties are available on the web site of the Convention. The previous analysis covered the period from 2004 to 2006.
The reports submitted by Parties to the Basel Convention, which are the basis of the analysis, show large gaps in the data on generation of hazardous and other wastes. In addition to the lack of data provided by about half of the Parties, the data between Parties are very difficult to compare, due to differences in national definition of hazardous waste and differences in measuring and reporting systems. Even the time series of the same Party can show extremely large differences over the years. In most cases Parties do not provide information about the background of such marked differences and these are therefore unexplained. To prepare the analysis of the data on generation, the information provided under the Basel Convention was complemented with data from the UN Statistics Division, the Organization for Economic Cooperation and Development (OECD) and Eurostat. By complementing the data in this manner, it was possible to develop an estimate of the amount of hazardous waste and other waste generated globally.
The dataset on transboundary movement is expected to cover the vast majority of the transboundary movements. However, in addition to the lack of data provided by about half of the Parties, the data between Parties are sometimes not comparable for instance because some include information on movements outside the scope of the Convention. An attempt has been made to exclude such data from the analysis, but this is not always possible because Parties do not indicate the status of the information very clearly.
Nevertheless, there are some interesting conclusions that can be drawn from the analysis.
- Only 50% of the Parties fulfill their obligation and transmit their reports in a given year. Quantitative information on the generation of hazardous wastes and other wastes is provided in only 25-30% of these reports. These percentages have not increased significantly despite the calls of the subsequent meetings of the Conference of the Parties (COP), the efforts of the Committee administering the mechanism for promoting the implementation and compliance of the Basel Convention (hereafter the ‘Implementation and Compliance Committee’) and the Secretariat. The revised reporting format to be used as for the year 2016 provides that the submission of such information has become optional.
- The generation of hazardous waste is estimated to have increased from 256 – 259 metric ton (MT) in 2007 to 390 – 394 MT in 2015. The most significant increases were seen in lower middle income and higher middle income countries.
- The amount of household waste that is generated worldwide in 2015is estimated to be around 1,6 billion MT. The amount has increased around 12% in the period 2007 – 2015. In particular in upper-middle income countries the increase was large and these countries generated in 2015 nearly the same amount of household waste as the high income countries.
- Between 2007 and 2015 the volume of transboundary movements increased from 9,3 to 14,4 million MT. This growth is mainly driven by an increased transboundary movements of household waste. The flow of hazardous wastes is more or less stable over the period. The amount is also more or less the same as in 2004 – 2006, even though the data for that period are not totally comparable with the current data.
- Based on the comparison of data on generation and on transboundary movement per country is can be estimated that overall, 97% of all hazardous waste that is generated stays within the country where it is generated and this percentage remains stable over the years. The high income countries export a higher percentage of the hazardous waste generated as they export nearly 6 percent of it. In the lower-income countries, export represents less than 0,5% of the hazardous waste generated. The situation however differs considerably per country, with some countries exporting the majority of their hazardous waste. These are often small countries which may have more difficulties setting up infrastructure to treat their own hazardous waste.
| Download |
| English: |
|
|
 |
| Download |
| Arabic: |
|
French: |
|
| Chinese: |
|
Russian: |
|
| English: |
|
Spanish: |
|
|
 |
| Download |
| English: |
|
Compilation of decisions related to enhancing cooperation and coordination among the Basel, Rotterdam and Stockholm conventions
| Download |
| English: |
|
|
 |
| Download |
| English: |
|
Russian: |
|
| French: |
|
Spanish: |
|
|
 |
| Download |
| English: |
 |
Compilation of Decisions: COP 6 - 10 and ExCOPs 1
The present publication compiles the decisions adopted by the Conference of the Parties to the Basel Convention at their sixth (2002), seventh (2004), eighth (2006), ninth (2008) and tenth (2011) meetings. It also includes the omnibus decision adopted by the Conference of the Parties to the Basel Convention at the first simultaneous extraordinary meetings of the conferences of the Parties to the Basel, Rotterdam and Stockholm conventions (2010).
| Download |
| English: |
|
|
 |
| Download |
| English: |
|
Vital Waste Graphics 3
From generation to disposal, waste is a by-product of societal dynamics, and all too often absent from our consideration. Vital Waste Graphics 3 seeks to put waste in context by:
- looking at some of the forces driving global trends;
- examining various concerns and the strategies developed to address them;
- considering the difficulties encountered in implementing these strategies.
| Download |
| English: |
|
|
 |
| Download |
| English: |
|
Synergies Decisions 2005 - 2011
Compilation of decisions related to enhancing cooperation and coordination among the Basel, Rotterdam and Stockholm conventions
The Basel, Rotterdam and Stockholm conventions are distinct and legally autonomous multilateral environmental agreements that share the common objective of protecting human health and the environment from hazardous chemicals and wastes for the promotion of sustainable development. To achieve this common goal, the conferences of the Parties to these three conventions have over the years adopted a series of decisions aiming at enhancing cooperation and coordination among the conventions. Thus, a framework for the so-called “synergies process” has been set.
The present publication compiles the decisions taken by Parties to the three conventions between 2005 and 2011 and provides a brief overview of the background and the development of the decisions.
| Download |
| English: |
|
|
 |
| Download |
| English: |
|
French: |
|
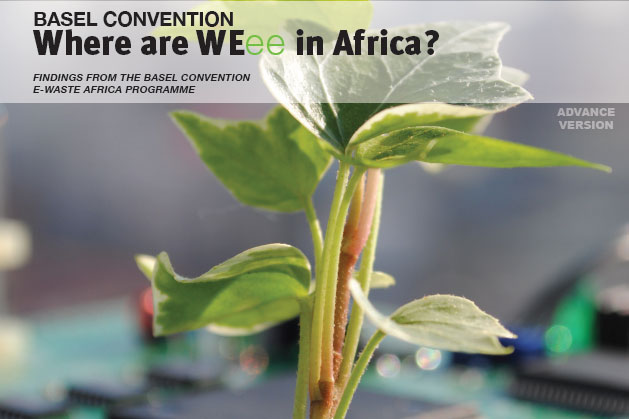
Where are WEEE in Africa? Findings from the Basel Convention E-waste Africa Programme
Information Communication Technology (ICT) has revolutionized modern living, international business, global governance, communication, entertainment, transport, education, and health care. This has been driven by unprecedented high volumes of production and usage of consumer electronic products, in particular, personal computers, mobile phones, and television sets. Access to ICT has been identified as an indicator of a country’s economic and social development. The difference in access to ICT between developed and developing countries is commonly referred to as the “digital divide”. Africa has been undergoing rapid ICT transformation in recent years, attempting to bridge this divide by importing second-hand or used computers, mobile phones, and TV sets from developed countries. The countries of the region, however, lack the infrastructure and resources for the environmentally sound management (ESM) of electrical and electronic waste (e-waste) arising when such imports reach their end-of-life.
| Download |
| English: |
|
French: |
|
|
 |
| Download |
| Arabic: |
|
French: |
|
| Chinese: |
|
Russian: |
|
| English: |
|
Spanish: |
|
Basel Convention & Basel Protocol on Liability and Compensation - Texts and Annexes
|
 |
| Download |
| English: |
|
Synergies Success Stories - Enhancing cooperation and coordination among the Basel, Rotterdam and Stockholm conventions
Examples of successful activities undertaken to implement the multilateral environmental agreements (MEAs) and other international frameworks in the hazardous wastes and chemicals cluster in a coordinated manner. The stories are based on national or regional projects and have been written by persons directly involved in activities at the national, regional and global levels.
| Download |
| English: |
|
|
 |
| Download |
| English: |
|
Waste without frontiers
The reported data on transboundary movements provide a rather good picture of the amounts of hazardous and other wastes generated and subject to transboundary movements globally. The following analysis shows that there has been progress on a number of issues addressed by the Convention, in particular in relation to the following points:
- Transboundary movements are increasing, but the vast majority of hazardous and other wastes is still treated within the country of origin and if waste is exported it stays, in most cases, within the same geographical region - in line with the principle of reducing to a minimum transboundary movements;
- Most of the waste that is moved across borders is moved for operations to recover, recycle, reclaim, make direct re-use or alternative use of the wastes concerned. From the information available, it appears that presently only high income member states of the Organisation for Economic Cooperation and Development (hereafter ‘OECD countries’) allow significant amounts of hazardous and other wastes to be imported for final disposal. It therefore may be assumed that these Parties would only accept such imports if they could treat these wastes in an environmentally sound manner;
- Imports of hazardous wastes by developing countries and countries with economies in transition are decreasing and exports from those countries to developed countries, where it is assumed these wastes can be treated in an environmentally sound manner, are increasing. Even though the ban on export of hazardous wastes from developed countries to developing countries adopted by the Conference of the Parties to the Basel Convention has not yet entered into force, such transboundary movements are already decreasing. The trends observed may, at least partly, be caused by underreporting by Parties.
- There is no evidence that significant amounts of hazardous wastes are being transferred from richer countries to poorer countries.
There are also areas where further progress may be needed:
- Continuous efforts should be made to encourage Parties to transmit their national reports to the Secretariat and to improve the quality and comparability of data in such reports;
- The quantitative information presently received about transboundary movements is satisfactory, but more information is needed about the generation of hazardous wastes and the quality of treatment in the states of import, to be able to assess if the goal of environmentally sound management of wastes is being achieved.
- More information on illegal movements should be made available and analyzed more systematically to detect areas of implementation of the Convention where further improvement could be made.
| Download |
| English: |
|
|
 |
|
 |
|